The Roehampton Annual Computing Education Report 2015
Dec 21, 2016
This report aims to analyse the uptake of computing / computer science qualifications at GCSE and A-level by looking at the schools that offered the qualifications and the students sitting them in 2015. Below are the key findings.
Key Findings
Despite computing’s place on the national curriculum as a foundation subject, only a minority of schools (28.5%) entered pupils for GCSE computing in 2015. At A-level, only 24% of providers entered students for the qualification. Provision of GCSE and A-level computing varied significantly across the country:
- There were 9 Local Authorities (LAs) where less than 2% of students took GCSE computing. At the other end of the scale, there were six (Reading, Blackpool, Newham, Sefton, Bournemouth and West Berkshire) where more than 10% of students are entered.
- 6.5% of students in the South East sat computing GCSE, compared to only 4.2% in the North East.
- Seven LAs had no A-level entries for computing. On the other hand, there were 5 LAs, (Poole, Bury, Hartlepool, Middlesbrough and Stockton-On-Tees) where more than 4% of students took A-level computing.
- 2.1% of students in the North West sat computing at A-level, compared to just 1.1% in Yorkshire and the Humber.
- Urban schools were more likely to offer computing at GCSE or A-level than those in rural locations (29.5% vs 22.7% and 25.1% vs 18.1% respectively).
- There was no significant difference between coastal and inland schools in provision of computing at GCSE or A-level.
There was considerable variation between school types in entries for GCSE and A-level computing:
- 51.1% of academy converters offered GCSE computing, compared to 37.8% of community schools, 37.1% of foundation schools, 35.2% of sponsor led academies and 34.8% of voluntary aided schools. Only 14.1% of independent schools and 2% of special schools offered GCSE computing.
- At A-level, 41% of further education institutions (including sixth form colleges) offered computing. 31.6% of Academy converters also offered A-level computing. Just 15.9% of independent schools did so.
- Boys and mixed schools were more likely to offer computing than girls schools. At GCSE 19.6% of girls-only providers offered computing compared to 31.6% of boys-only and 29.1% of mixed providers. 9.3% of girls-only providers offered computing at A-level compared to 43.7% of boys-only and 24.5% of mixed providers.
- Grammar schools were much more likely to offer computing than non-selective state schools: 53.1% compared to 31.7% of schools at GCSE, and 46% compared to 24.7% at A Level.
- School size was linked closely with the likelihood that computing GCSE be offered, although the same is true for other subjects, such as physics and ICT.
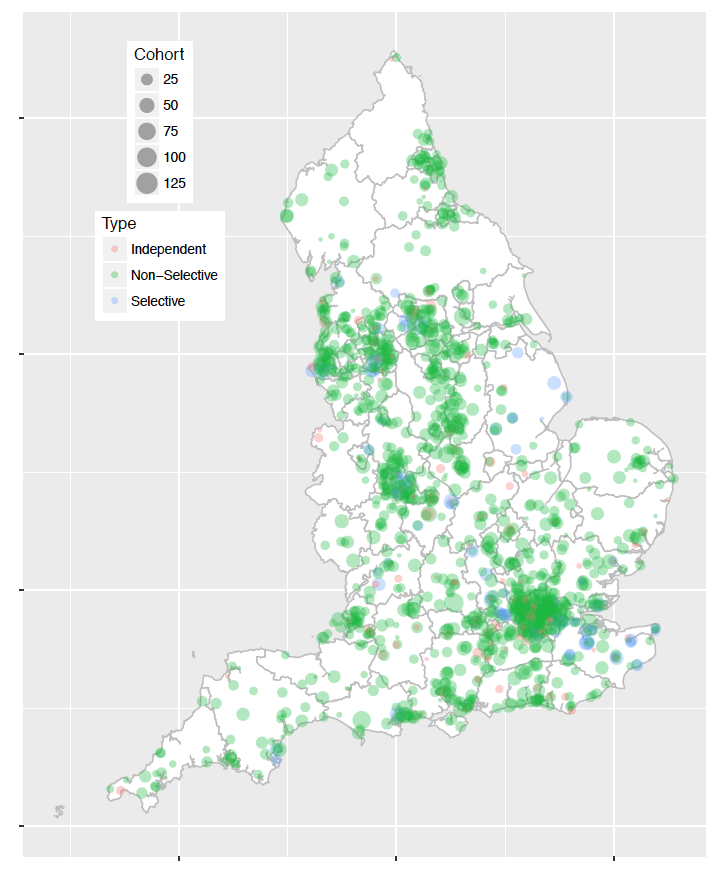
At GCSE, it was very unusual for computing to be taken by the majority of students in a year group – there were only twenty-one schools where this was the case, seven of which were independent schools. Nevertheless, cohort sizes at GCSE might be considered robust, averaging 22.9. 47.6% of schools offering computing did so with groups smaller than 20 at GCSE. At A-level, cohort sizes were much smaller, with a mean of 7 and a median of just 4. 58.5% of A-level computing providers had fewer than 6 entries. The average cohort size for further education institutions (including sixth form colleges) that offer A-level computing was 18.5, but academy converters offering the subject had an average cohort size of just 5.7 . If the number of students taking computing A-level in many of these providers does not increase then questions are likely to be raised over the economic viability of the qualification due to recent sixth form provision funding changes. Where computing provision did exist in mixed schools, girls were often absent. At GCSE 26.9% of mixed providers had no female students, at A-level the figure was 65.3%.
The entitlement to computing which the national curriculum provides did not appear to be maintained at GCSE or A-level. Only a small fraction of pupils chose (and/or were allowed) to take qualifications in computing: 5.5% of GCSE students and only 1.7% of A-level candidates. As with schools’ take up of the qualification, so with individual students’: there is considerable variation between gender, socio-economic status and ethnicity.
- Pupil premium students were under-represented in GCSE computing (19%, compared to 26.6% across GCSE entries); entrants had a lower IDACI index than the average (0.194 vs 0.218). Pupil premium students, on average, scored worse than their peers.
- At A-level, pupil premium students’ uptake of computing was close to the average for all subjects (8.9%, compared to 9.0% across A-level entries), although the IDACI score was still lower (0.161 vs 0.178). The attainment gap between pupil premium and non-pupil premium students for computing was broadly the same as across all subjects. Only 34 pupil premium girls took A-level computing in 2015.
- Asian and Chinese students were a higher proportion of GCSE computing students than across the national cohort; black students somewhat lower. At A-level, white and Chinese students made up a higher proportion of the computing cohort, other ethnic groups rather lower.
- Whilst pupil premium students were less likely to sit GCSE computing than their peers, the propensity of girls to sit computing was not as reduced by pupil premium as it was for their male counterparts. Amongst all pupil premium groupings, white British girls were proportionally underrepresented.
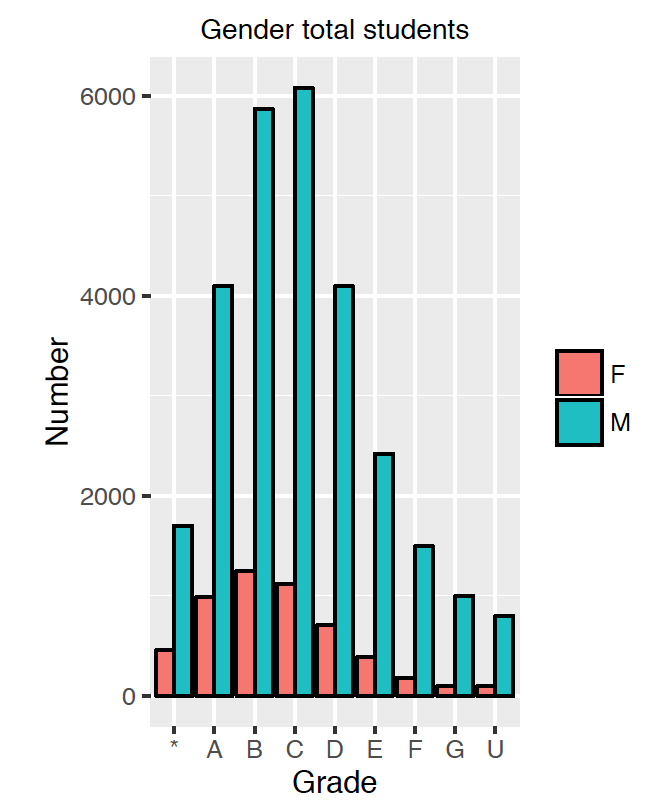
At GCSE computing, girls outperformed boys, achieving proportionally more A* to B grades, and proportionally fewer other grades. A-level shows a similar pattern to GCSE, with girls, achieving proportionally more A* to B grades, and proportionally fewer other grades.
Computing students might be characterised as relatively academic, although performance on exams is rather lower than might be expected given the entry profile. It is unclear whether this is due to the relative difficulty of the qualification, teaching in the subject or some combination of these and other factors. Computing and ICT seem rather different qualifications:
- At GCSE and A-level, ICT has a much more equitable gender spread than computing.
- At GCSE, 1433 providers offered computing, which was taken by 32820 students, compared to 1886 providers offering ICT, taken by 93015 students.
- At A-level, 697 providers offered computing, which was taken by 4890 students, compared to 804 providers offering ICT, taken by 6650 students. Larger sixth form or FE colleges are more likely to offer A-level Computing rather than ICT, perhaps as the ICT qualification offered in such institutions is more likely to be one of the vocational alternatives.
- 3167 students (9.6% of the computing cohort) took GCSEs in both computing and ICT. 156 students (3.2% of the computing cohort) took both computing and ICT at A-level, a combination offered by only 240 (8.3%) of providers.
- Computing students were more likely to take triple science than ICT students at GCSE: Only 1126 students took computing as one of three EBacc sciences (3.4% of computing entries), although a further 10849 (33.1%) took computing as one of four science subjects.
- At A-level, computing was often combined with maths, further maths and physics – the latter two were subjects which did not feature highly in combination with ICT.
- Asian students had similar representation at both GCSE ICT and computing, but at A-level they had a much higher representation in ICT.
- Pupil premium students were substantially under-represented in GCSE computing (19%) compared to ICT (27.1%). The student average IDACI rating for students sitting computing (0.194) was substantially below that for ICT (0.233).
- At A-level, the percentage of pupil premium students for computing (8.9%) was below ICT (11%) and the student average IDACI rating for students sitting computing (0.161) was substantially below ICT (0.195).
- Students sitting GCSE computing had a stronger mathematics profile than students studying ICT.
Recommendations
-
Increase the proportion of schools and colleges offering GCSE and A-level computing.
- This can be achieved through applying models of provision in areas and school types where computing is well represented to those where it is presently under-represented.
- Initiatives such as PiCademy, the CAS master teacher programme, CAS hubs and the CAS regional centres should prioritise extending support to areas and schools with low levels of provision.
- National teacher training initiatives, such as Teach First, should look at focusing their computing provision in areas of low provision.
-
Schools and colleges offering computing should aim to expand the numbers of pupils and students taking the qualification.
- This can be achieved through addressing the relative under-representation of girls, some ethnic groups and, in the case of GCSE, pupil-premium students. Schools and colleges should consider carefully if selection policies for computing classes are unnecessarily restrictive or discriminatory.
- Schools should consider if changes are needed in the teaching of computing to bring outcomes in line with those which entry profiles would indicate.
- Awarding organisations should consider whether qualifications on offer are sufficiently appealing to pupils and to schools and colleges. They should consider whether grade expectations are in line with other qualifications they offer.
- Whilst the new computing curriculum is being established, there should be financial support for schools to offer the subject so they can build up sustainable cohort sizes.
- Discussions around diversity and computing should include socio-economic and ethnic factors in addition to gender.
- The impact resulting from the removal of ICT qualifications at KS4 and KS5 needs to be studied. Will students with profiles similar to those taking ICT in 2015 now sit Computer Science in similar numbers, find alternative provision through vocational qualifications, or will they show decreased access to qualifications in the IT / computer science space?
The research topics outlined in this report need further study, in particular there seems a pressing need to explore:
- the uptake of GCSE computing amongst pupil premium females.
- the regional distribution of computing provision across other factors such as gender and pupil premium.
- factors that might explain under-performance in computing.
- the uptake of other qualifications in the IT, digital media and computer science at at pre-university level.
This is the executive summary of The Roehampton Annual Computing Education Report 2015, published 13 December 2016.
Share